
Chauka
This is a global warning.
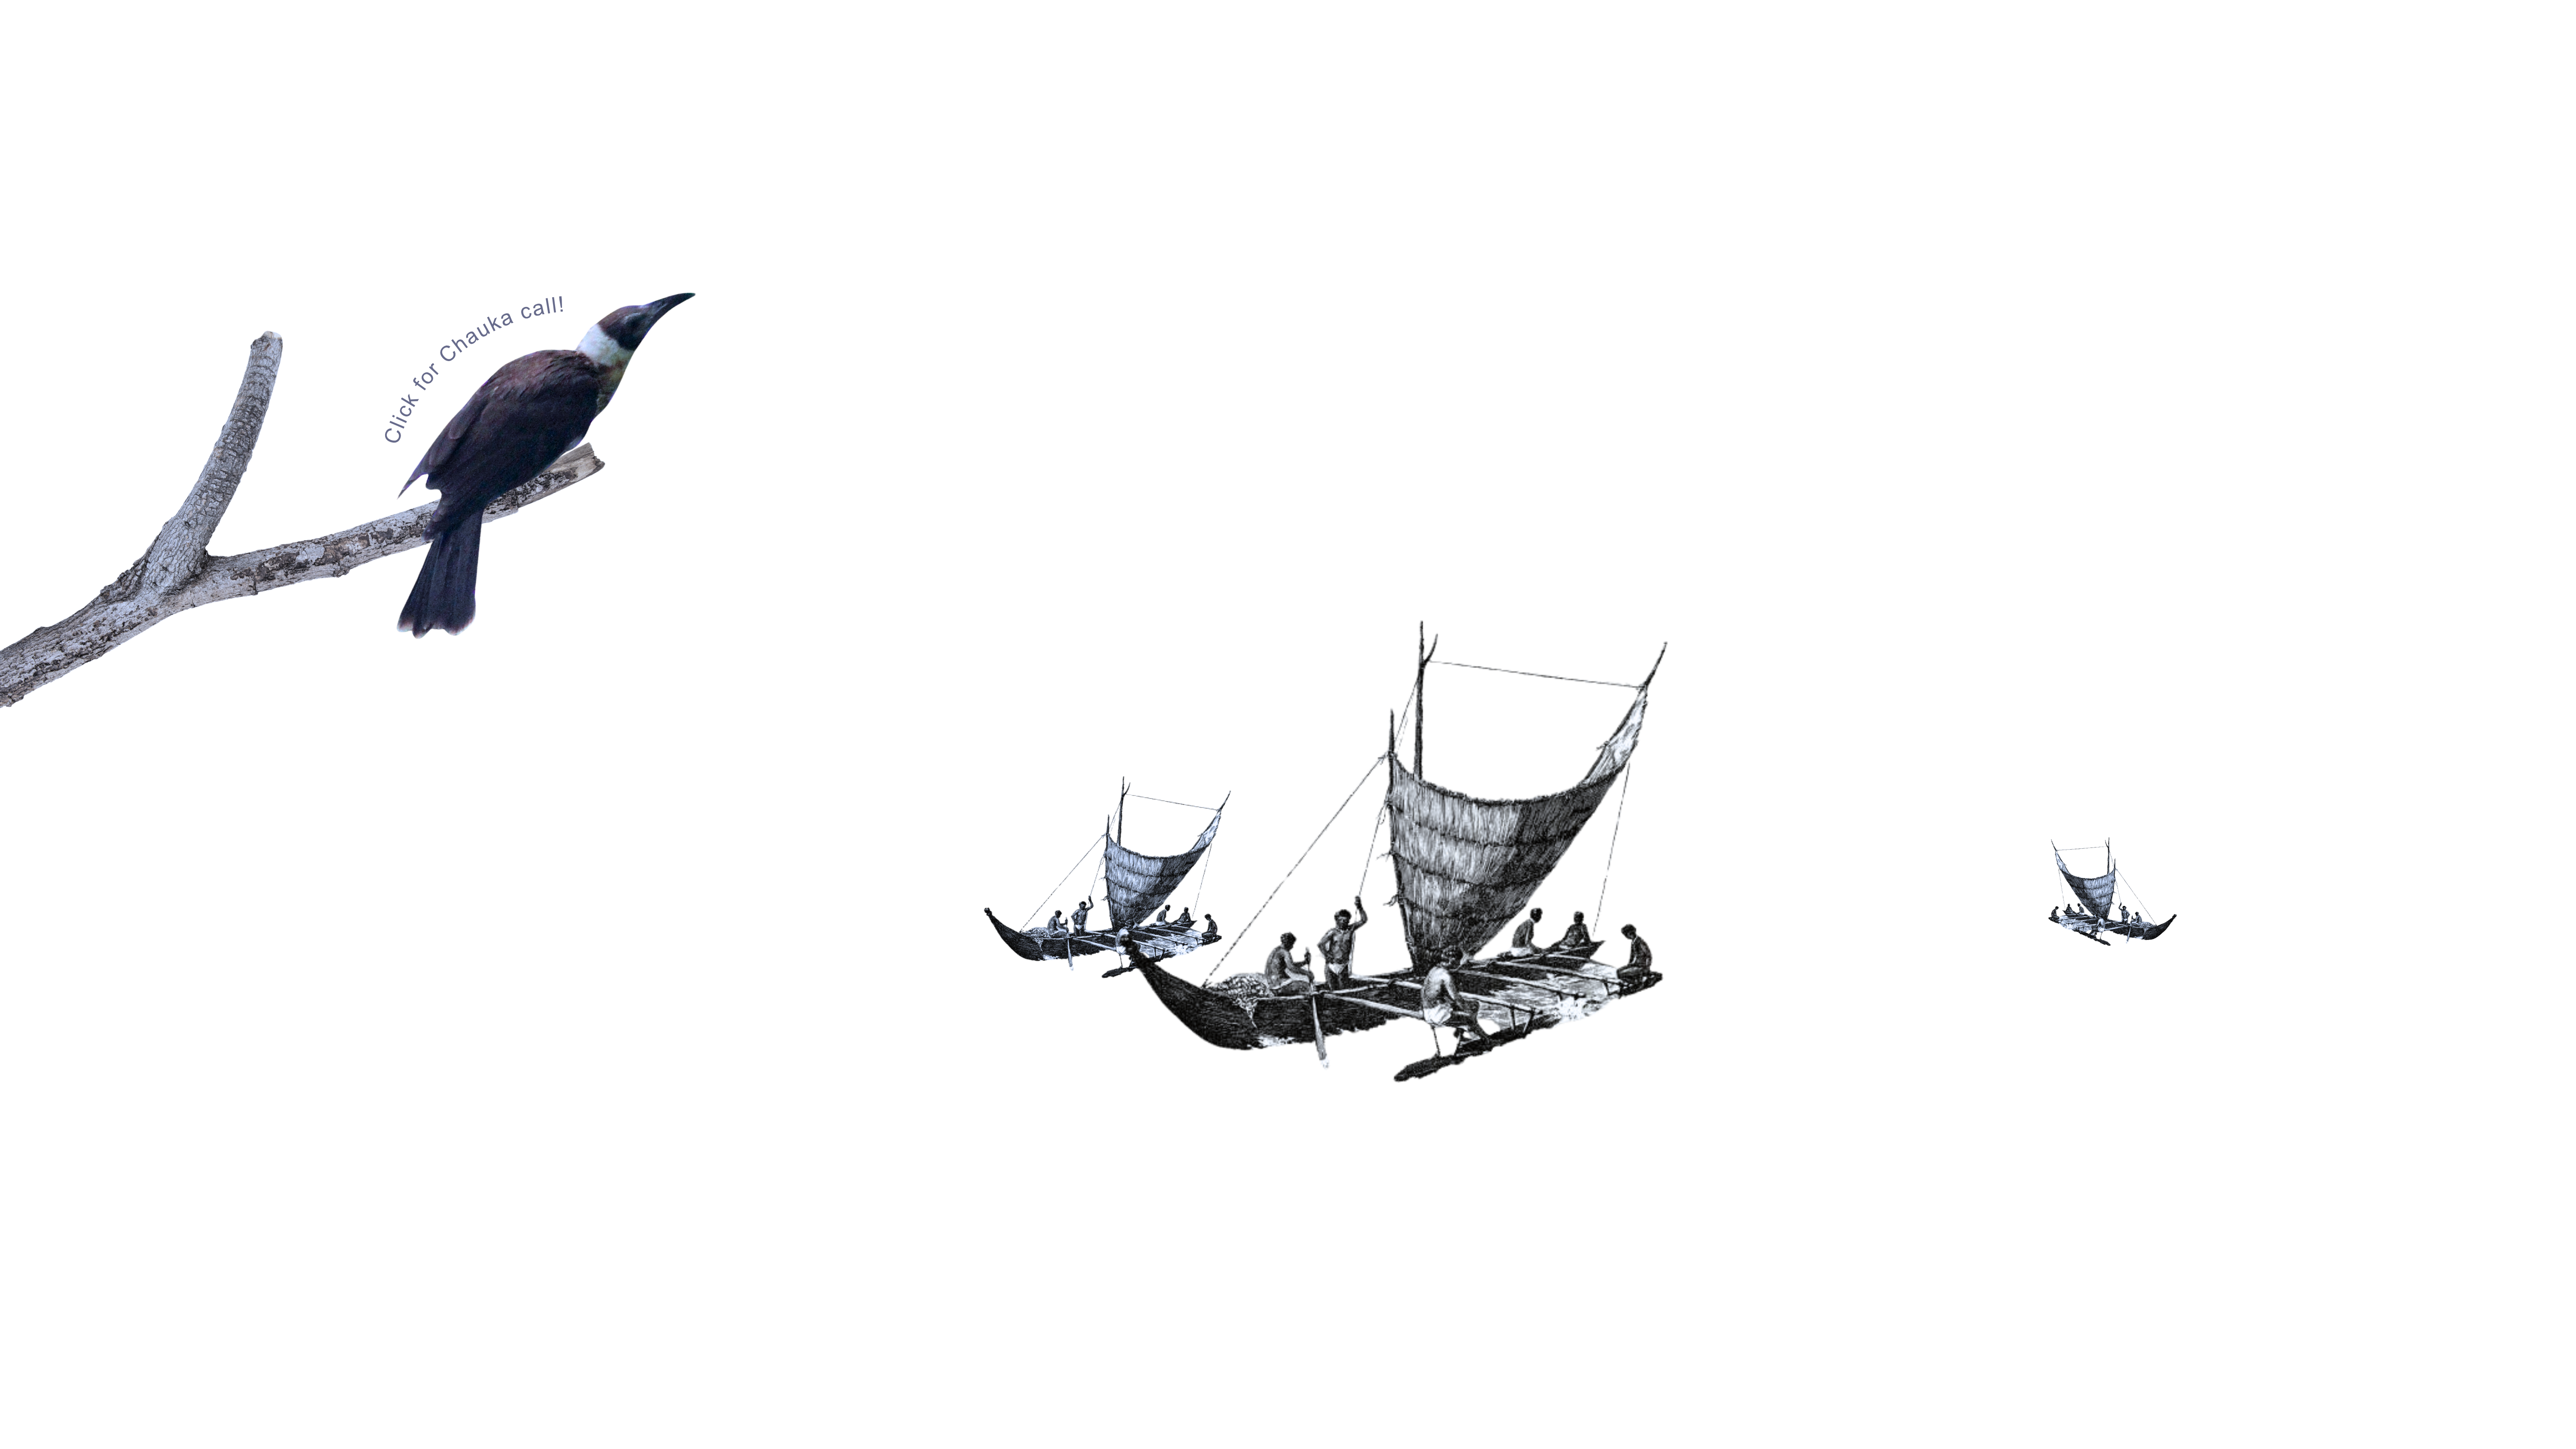
On Manus Island, the Chauka bird once warned villagers when something was wrong. Its call meant: stop and pay attention.
Now, the ocean is calling.
It sends signals through rising tides, salt in gardens, and floods that reach farther each year. Pacific Island nations are the first to feel this. They didn't cause the crisis, but they are living with its consequences.
Elsewhere, people may not notice yet. But the warning is already here.
This is a global warning.

Sea levels held steady for a millennium,
until now.
For most of the past millennium, sea levels remained relatively stable. But since the late 19th century, they have risen sharply due to climate-driven ocean warming and ice melt. Flooding worsens, drinking water is affected, and coastal communities are under threat.
Under 1.5°C to 2.0°C of global warming,
sea level rise is expected to increase by
~25 cm in 2050.
Sea level is rising,
but not at the same rate.
Sea level rise is uneven. The Pacific is a hotspot. Driven by ocean patterns, melting ice, and land movement, some islands are seeing faster-than-average increases. For nations with limited land and elevation, these trends bring real and immediate threats.
Fig 2: Projected sea level rise scenarios, across selected Pacific Island nations. Data: Pacific Flooding Analysis Tool (link)
Impact varies across Pacific islands
low-laying islands are exposed more.
Low elevation makes many Pacific islands especially vulnerable to sea level rise. When land sits just a few meters above the ocean, even small increases can overwhelm coastlines. With nowhere higher to go, communities face growing challenges to stay safe, maintain clean water, and protect their homes.
PACIFIC ISLANDS (M)
Fig 3: Average elevation of selected Pacific Island nations and territories. Data: Wikipedia (link)
Many islanders live just above sea level,
where sea rise is already felt.
Many Pacific Island nations have significant populations living in low-lying coastal areas. These communities are particularly vulnerable to sea level rise and coastal flooding, as even small increases in sea level can have dramatic impacts on their daily lives and infrastructure.
ABOVE SEA LEVEL (%)
Fig 4: Percentage of national populations living between 0–5 meters above sea level in selected Pacific Island nations. Data: Pacific Data Hub (link)
Climate risks are rising in the Pacific.
So is human impact.
Flooding is not the only threat. Cyclones, droughts, and heat extremes are also affecting more people across the Pacific. While impacts vary by island and year, some nations have seen sharp spikes in those affected. The trend points to growing vulnerability as the climate continues to change.
Conclusion
The Pacific is on the front lines of the climate crisis. While sea levels are rising globally, their impacts are not evenly distributed. Low-lying island nations such as Tuvalu, Kiribati, and the Marshall Islands, with an average elevation of just 2 meters, face an existential threat from even modest increases in sea level. These islands have little elevation to buffer rising tides and no higher ground for retreat.
But elevation alone does not tell the full story. Ocean currents, land movement, and storm exposure all contribute to risk, making some regions more vulnerable than others. Climate hazards that were once rare are becoming more frequent and disruptive.
In recent years, hundreds of thousands of people in the Pacific have been affected by floods, cyclones, and droughts, showing a sharp rise in human impact.
The data points to a clear trend: as the climate warms, the risks for Pacific communities are increasing. What is happening in these islands is not just a warning, but a preview of what coastal regions around the world may face if emissions and sea level rise are not brought under control.
And yet, these islands are not only sites of risk. They are also places of resilience. Across the region, communities are responding with deep-rooted knowledge, creative adaptation, and collective action. From youth-led campaigns to cultural expression and traditional practices, Pacific peoples are drawing on both heritage and innovation to protect what matters.
The rising sea threatens homes and homelands, but it cannot erase identity, memory, or the will to adapt.
This is not only a story of loss. It is also one of resilience.
Material and Method
This project is built with Next.js, React, and Three.js, combining interactive 3D mapping and data visualization. Charts are rendered using Recharts and D3.js, while styling is handled with Tailwind CSS and PostCSS. The source code is available on GitHub.
The 3D star globe is based on data from the Hipparcos and Tycho Catalogues. Additional charts use data from the Pacific Data Hub and the EM-DAT public disaster database. Exact datasets are linked in the captions of each visualization.
The narrative is rooted in a story from Manus Island. It is woven into the experience alongside sound to create a layered, sensory way of engaging with the data.
Music: Leve Yam - Keni Lucas Ponyalou
This project is a collaboration between Bertha Ngahan (Storytelling) and Janina Grauel (Visualization) for the Pacific Data Challenge.